Cryogenic FIB-SEM
Capture a Snapshot of Cellular Dynamics at Near Native States in Ultraresolution
Schematic Representation of a Typical Workflow


1
A trench is milled into a vitrified, unstained sample with a focused ion beam until the structure of interest becomes visible.


2
The newly exposed sample surface of the structure of interest is imaged. This milling and imaging process is repeated until the structure is completely imaged. The sample stays vitrified during the entire process.


3
The acquired EM images are processed and digitally aligned into a 3D data set. Cell compartments can be identified and segmented.


4
The segmented 3D data set can be visualized, investigated, and statistically analyzed.
Application Example
Understanding the Biomineralization Process of Calcite Crystals in a Coccolithophorid Alga
Formation of Coccoliths in the Coccolithophore Emiliania Huxleyi
Visualization of Calcite Particles and Their Ultrastructural Environment
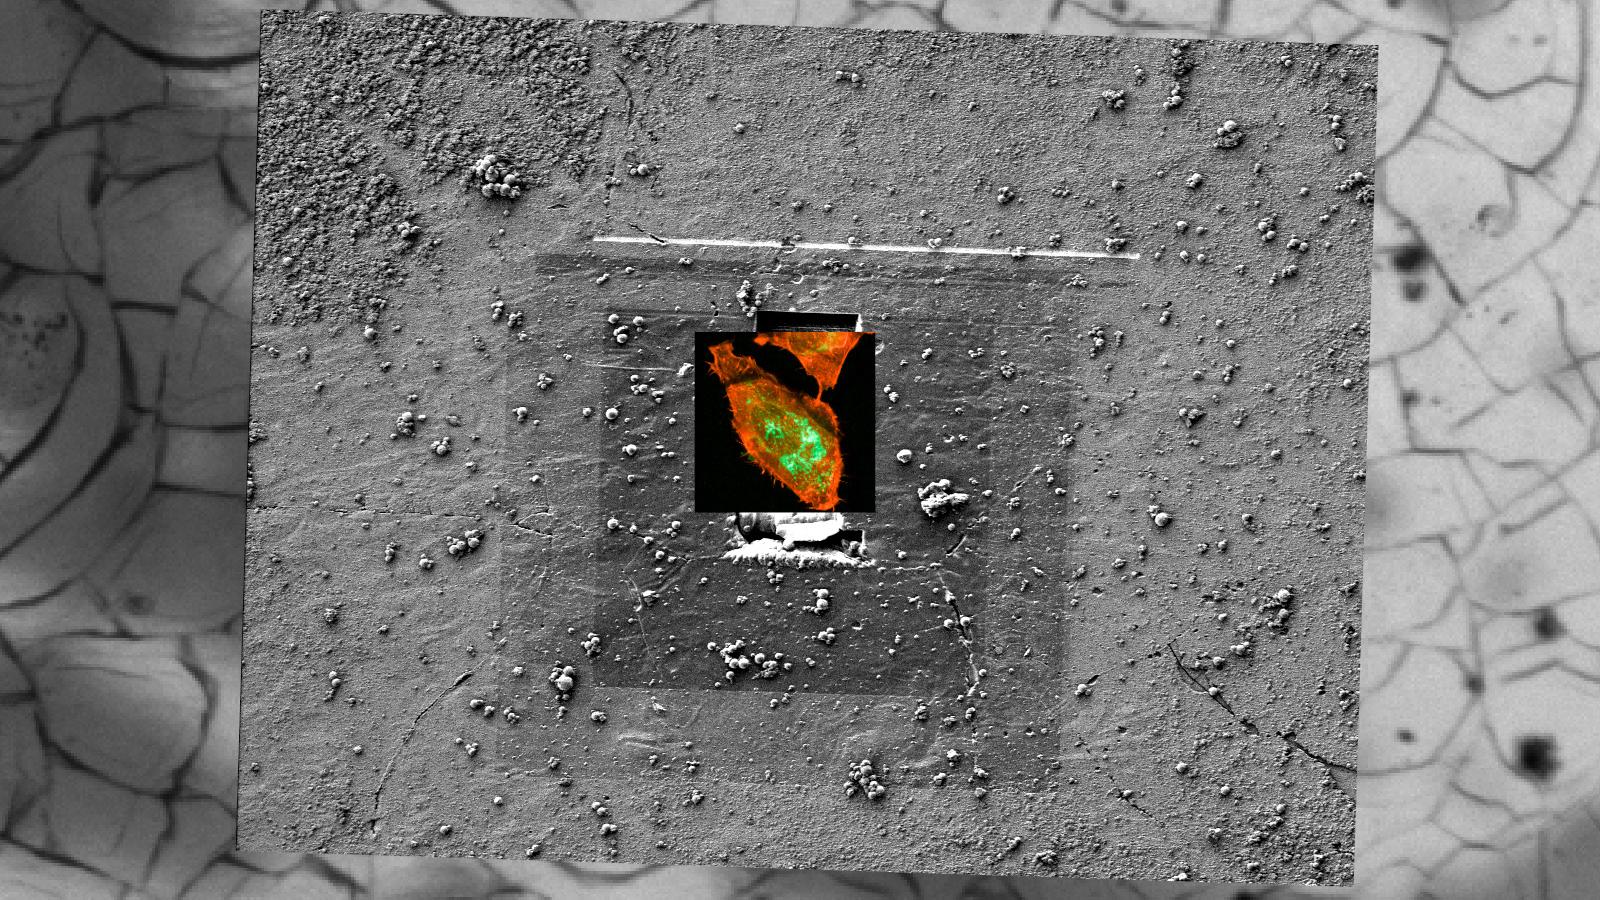
The ultrastructural environment of soluble, amorphous calcium phases of coccolithophores is difficult to image with the classical, water-based preparation protocols. FIB-SEM operated under cryo conditions enables to image vitrified marine algae in the near-to-native state elucidating the ultrastructure in 3D.
E. huxleyi cells were high-pressure frozen. During the imaging process, the sample was kept in a frozen state; the FIB-SEM data set was acquired using a ZEISS Crossbeam under cryogenic conditions. The 3D reconstruction shows the mature coccoliths (yellow), a coccolith in statu nascendi (blue) and lipid bodies (red).